Docs / Bastion Circuit Designer manual / User manual
User manual
Version 0.9.1-alpha · Windows 10/11 (x64) · Download · Report a bug
Bastion is a circuit design and simulation workbench. You draw a schematic, press Run, and the circuit comes alive: the solver computes every voltage and current in microseconds, wires colour themselves by voltage, and little electron particles flow along them in proportion to the real current. You can poke the circuit while it runs — flip switches, turn potentiometers, type into a microcontroller's serial monitor — and watch what happens. When you are done, export a schematic image, a KiCad project, a Gerber package for manufacturing, or a 3D-printable enclosure.
This manual walks through every part of the program, in the order you will meet it.
Part pictures and the sound of the workbench
Every common part has a picture. Hover a card in the component library and the part's photo appears with its name; select a component and the inspector shows the same picture and name at the top. The pictures are public domain, CC0 or CC BY only (see the parts gallery for the full credit list), and a part with no suitably licensed photo simply shows no picture rather than a placeholder.
The workbench makes small sounds. Short synthesised blips mark the start and stop of a run, a component
placed, a wire completed, a failed action, and a verification pass or failure. They are generated by the app
itself (nothing is downloaded) and they are easy to switch off: Simulate > Interface Sound Effects (SFX), the
SFX button in the toolbar, or the environment variable BASTION_UI_SOUND=0.
A buzzer or speaker in the circuit really sounds. While a simulation runs, a piezo buzzer part is
listened to: the solver's voltage across it is measured, the fundamental frequency is taken from the time
between rising edges, and that tone is streamed to your speakers - so a firmware PWM sweep is audible, and a
part driven with DC stays quiet. It follows the same master volume and mute as the rest of the audio.
1. Installing and starting
1.1 Installer (recommended)
Download Bastion-<version>-setup.exe from the project page and run it. The installer is per-user
(no administrator prompt), adds a Start Menu entry, and can be removed from Settings ▸ Apps like
any program. Your circuits and settings live in %APPDATA%\Bastion and are never touched by
uninstall or upgrade.
1.2 Portable
The publish-standalone folder (or the single-file Bastion.App.exe) runs anywhere without
installation. Keep the whole folder together — the examples/ folder and the bundled SPICE
library live next to the executable.
1.3 First launch
The first launch opens the workbench with the last session restored (or a small starter circuit if this is the very first run). You can open a circuit directly from a command line or a file association:
Bastion.App.exe "D:\circuits\my-project.eda.json"
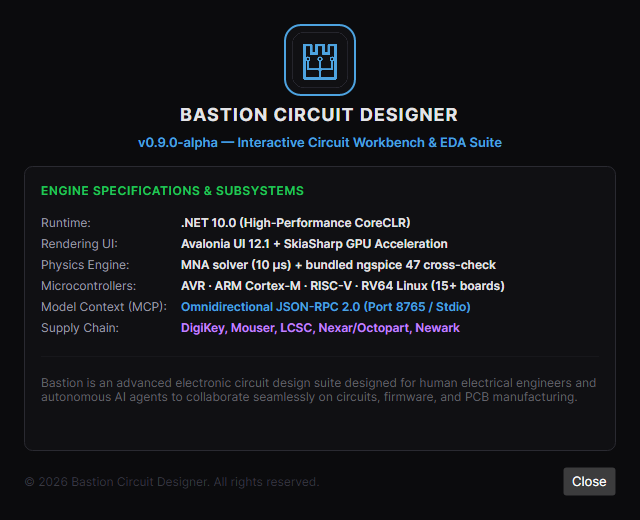
The exact build you are running — version, licence and which subsystems are active — is in Help ▸ About Bastion:
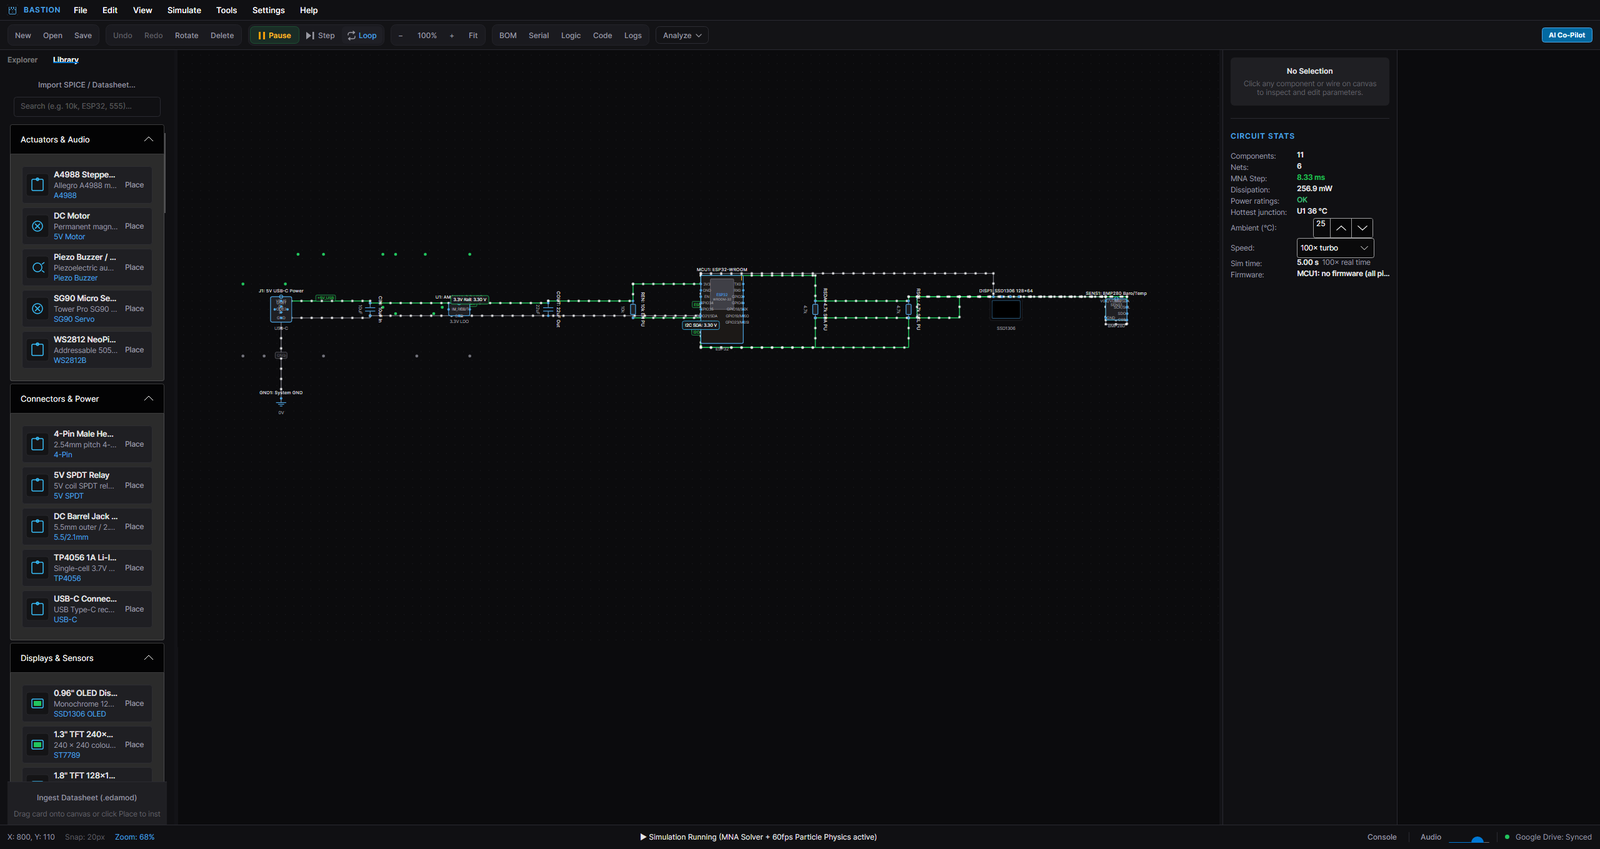
2. The window at a glance
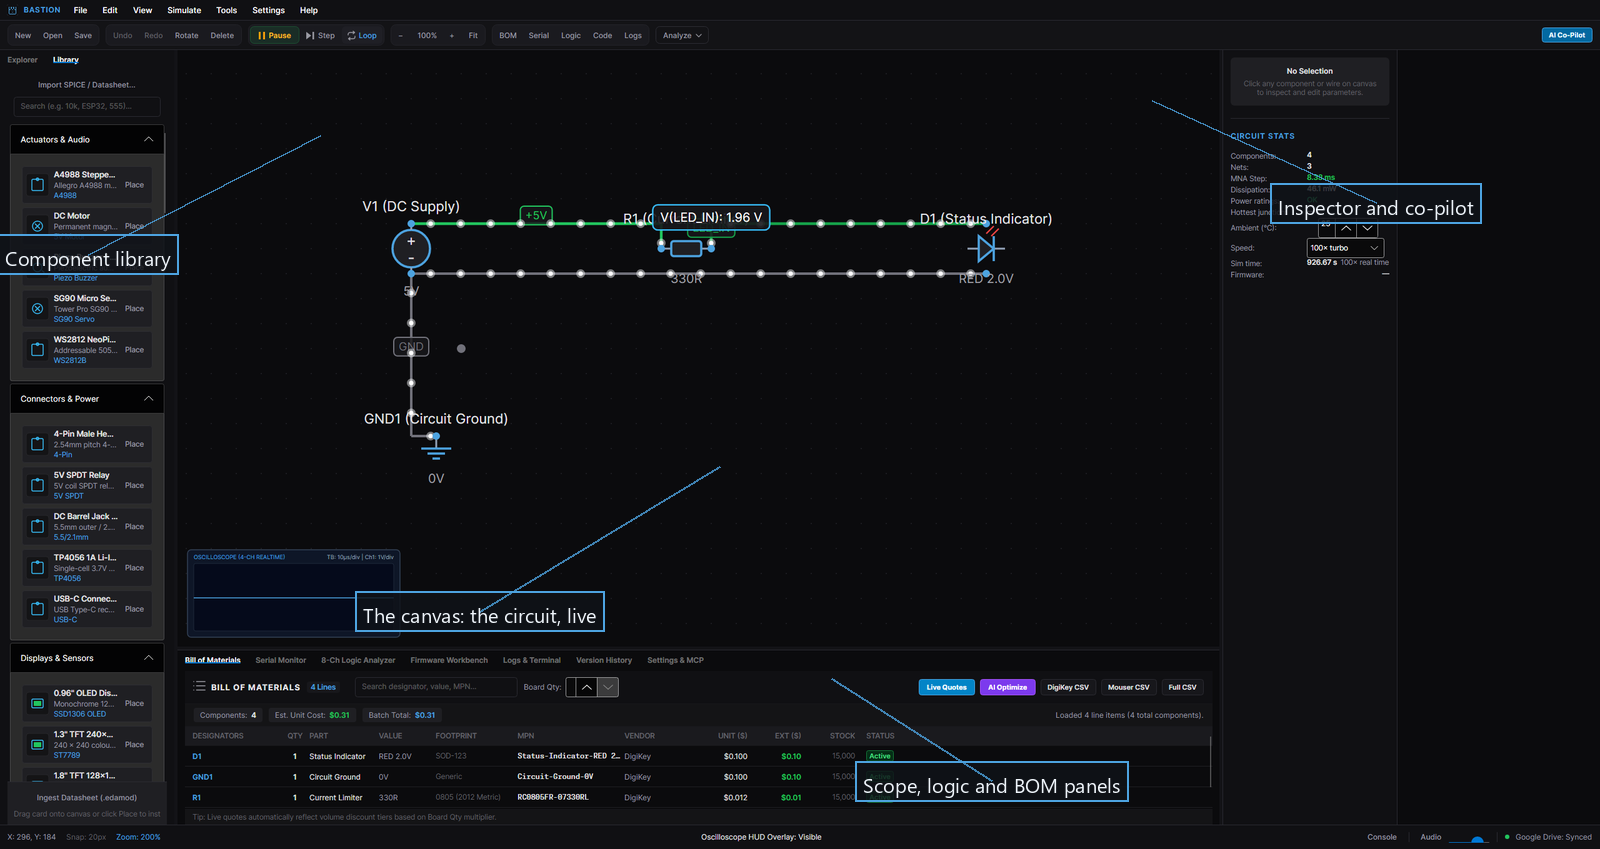
| # | Region | What it is for |
|---|---|---|
| 1 | Menu bar | File, Edit, View, Simulate, Tools, Settings, Help — everything is also reachable here |
| 2 | Toolbar | New / Open / Save · Undo / Redo · Rotate / Delete · Run / Step / Loop · zoom · panel buttons (BOM, Serial, Logic, Code, Logs) · Analyze menu · AI Co-Pilot |
| 3 | Explorer / Library sidebar | Left tab Explorer: your sheets, examples and imported modules. Left tab Library: the component catalogue with search and categories |
| 4 | Canvas | The schematic itself: grid, components, wires, probes, live animation |
| 5 | Inspector (right, upper) | Parameters of the selected component or wire, plus the Circuit stats box (components, nets, dissipation, ratings, sim time) |
| 6 | AI Co-Pilot (right, lower) | The in-app assistant: ask it to build, modify, explain, or run things |
| 7 | Bottom drawer | Tabs for Bill of Materials, Serial Monitor, 8-Ch Logic Analyzer, Firmware Workbench, Logs & Terminal |
| 8 | Status bar | Cursor position, snap, zoom, selection, status message, console / audio / Google Drive indicators |
The layout is fluid: drag the splitter between canvas and inspector, collapse the sidebar, or
toggle the bottom drawer with Ctrl+B. Zoom with the mouse wheel or Ctrl + / Ctrl -, pan with
the middle mouse button (or space-drag), and press Fit to frame the circuit.
3. Your first circuit: an LED with a resistor
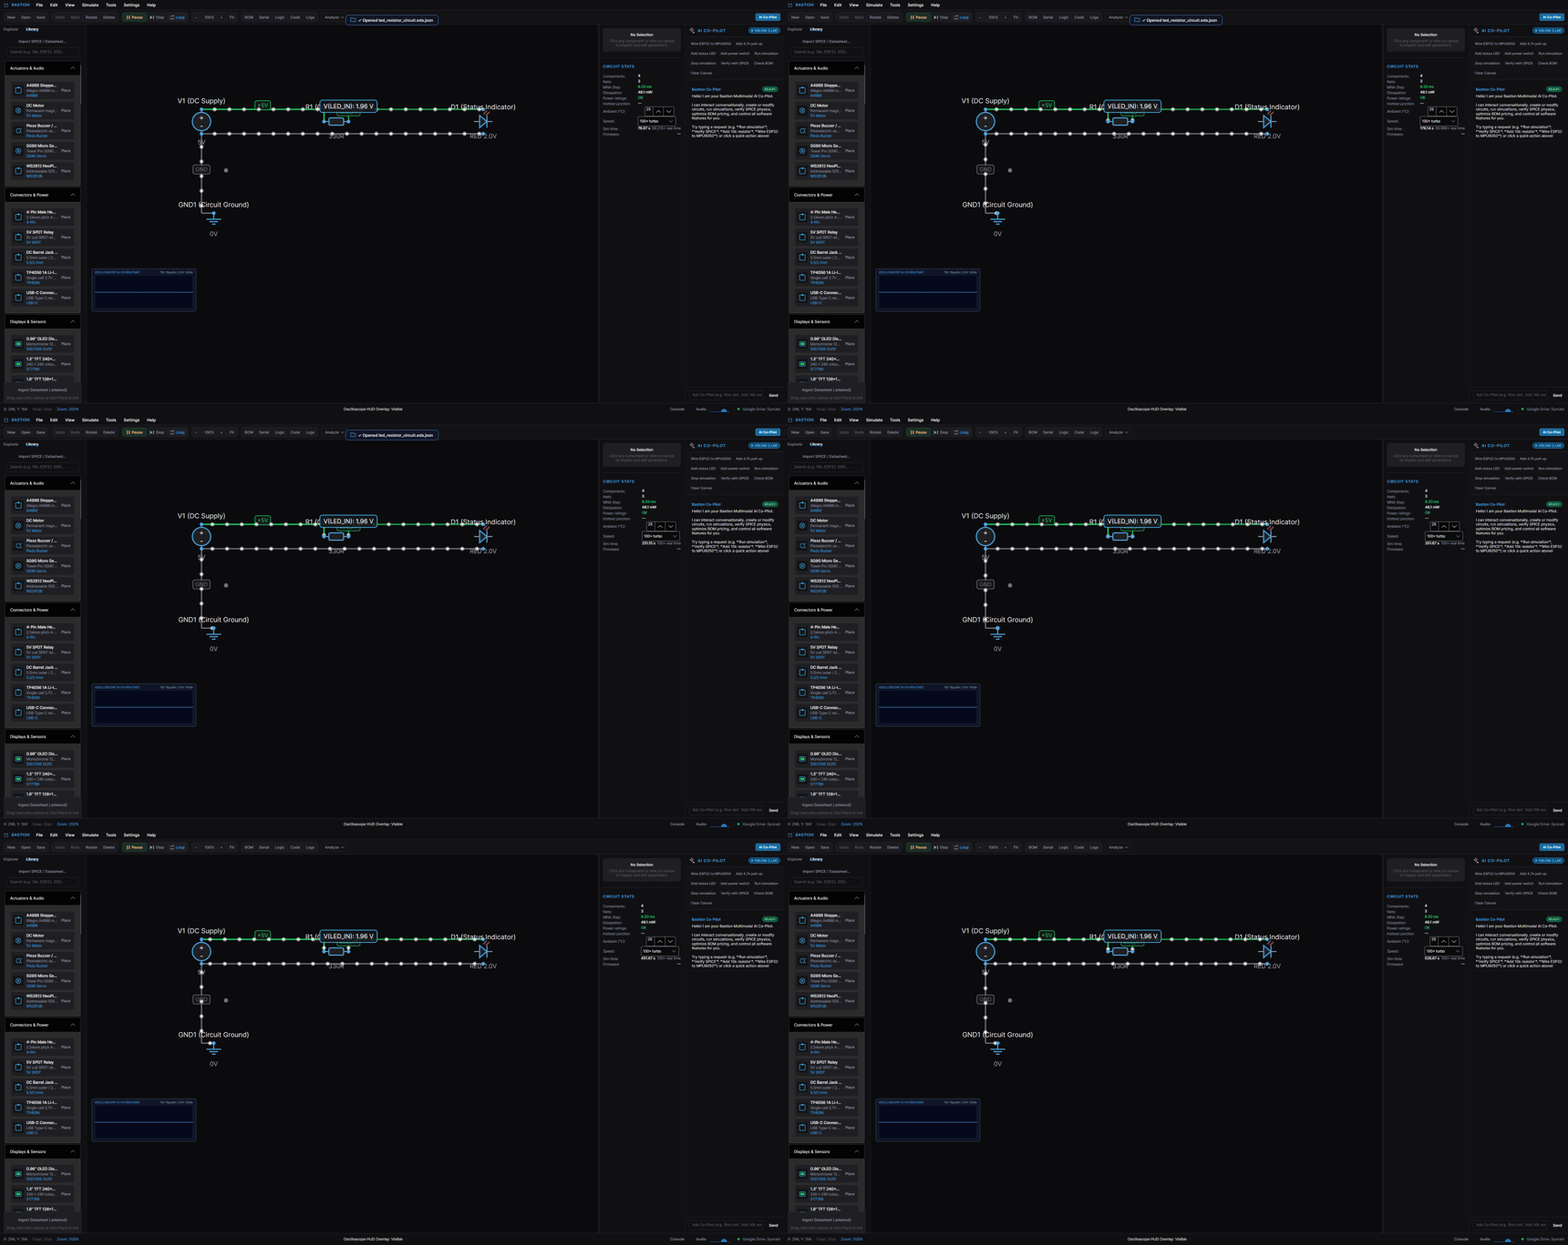
A light-emitting diode needs a current-limiting resistor, or it burns out. In Bastion "burning out" is not fatal — the power-rating monitor will simply tell you — but let us build it correctly.
- Place the supply. In the Library search box type
5V. Drag DC Supply onto the canvas, or click its card and click again to drop it. It arrives asV1with 5 V. - Place the resistor. Search
resistor; drop one to the right of the source. Click it and set Value to330in the inspector (330,330Rand330Ωall work). - Place the LED. Search
LED; drop it right of the resistor. - Place ground. Search
ground; drop it below, then wire the LED's cathode to it. - Wire it up. Hover a pin — a gold terminal appears. Press and drag from one pin to the next;
Bastion routes an orthogonal wire. Connect: supply
+→ resistor pin 1, resistor pin 2 → LED anode (A), LED cathode (K) → ground. - Press Run (or
F5). The wires turn green as the current flows and particles stream along them. The status bar reads Simulation Running.
What just happened: the solver found the operating point of a 5 V source, a 330 Ω resistor and an LED with a ~2 V forward drop — about 9 mA through the loop — and the canvas is showing you that current as particle speed. Select the LED and look at the inspector: it lists the pin nets and the forward voltage the model uses. The Circuit stats box shows the total dissipation (in this case the resistor doing the heating, ~27 mW — well within its 250 mW rating, so the rating line reads OK).
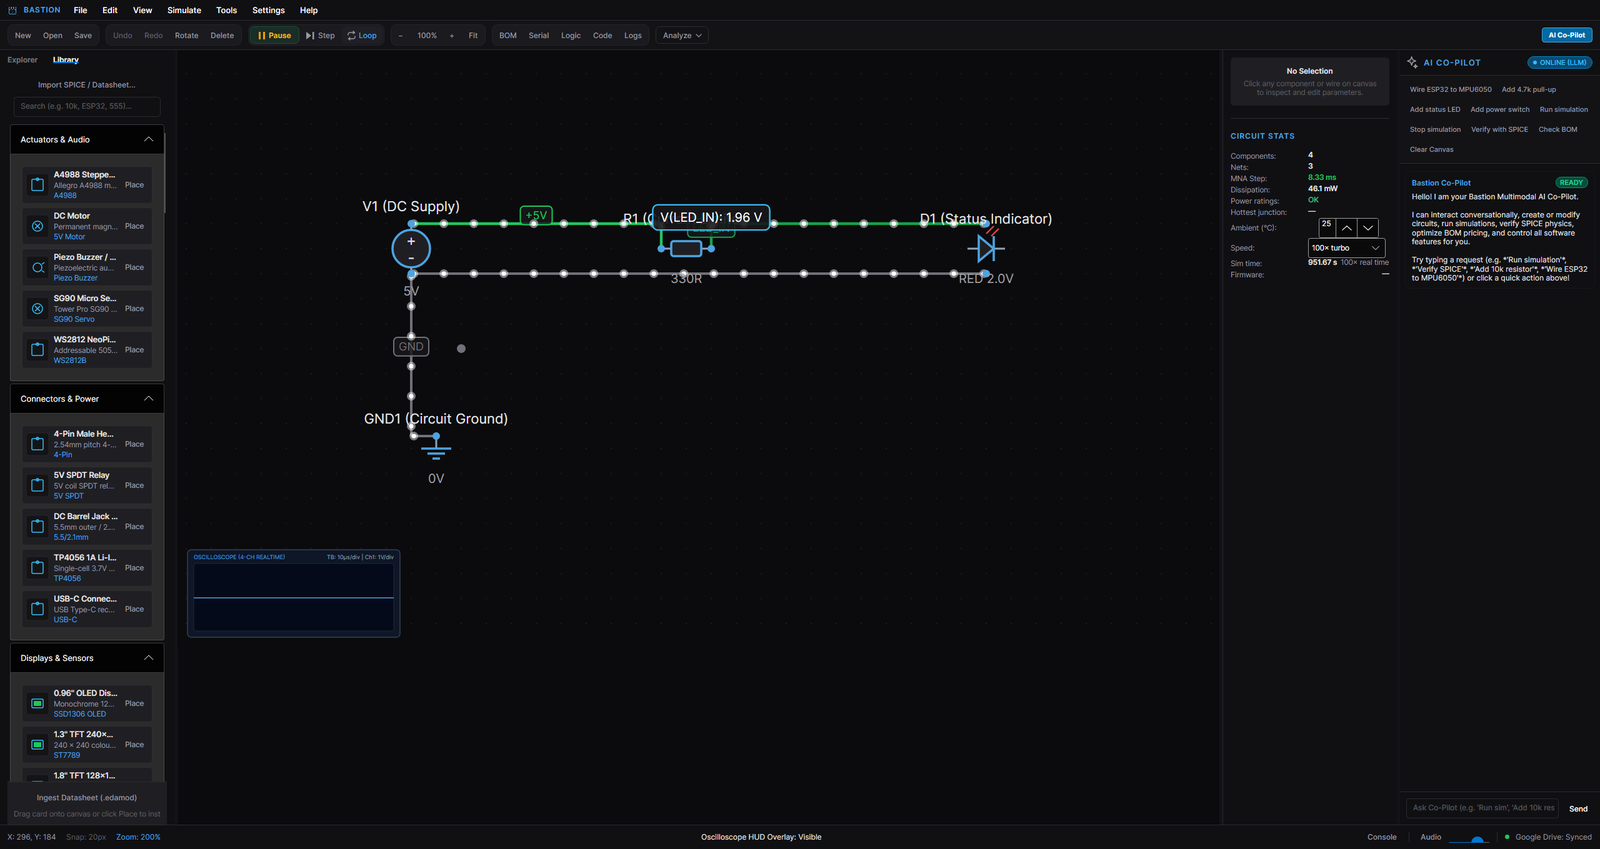
The still above is the same circuit with the simulation stopped: the inspector shows the LED's model parameters, and the Circuit stats box in the corner summarises components, nets, dissipation and the rating verdict.
Try it: set the resistor to
10and press Enter while the simulation runs. The dissipation jumps, the resistor's halo turns amber (caution) or red (overload) and a toast appears: that is the power-rating monitor doing its job — the same check that runs in the SPICE verification gate.
3.1 Editing while it runs
The simulation never locks the editor: move parts, rotate them, change values, add or delete wires — the circuit is recompiled on the next step. Interactive parts respond to the mouse:
- Switches / pushbuttons — click to toggle (or hold, for momentary buttons).
- Potentiometers / trimpots — drag the wiper knob; the split changes live.
- Sensors with dials (IMU tilt, temperature, light) — the inspector exposes their sliders.
- Displays — show what the firmware sends, live, on the canvas and in the Display Monitor.
4. The canvas and the component library
4.1 Placing components
The Library lists every built-in part in categories (Passives, Diodes & LEDs, Transistors,
Logic & Analog ICs, Displays & Sensors, Microcontrollers, Connectors & Power, Drone & Marine,
Actuators & Audio). Type in the search box to filter by name, value or part number (10k,
ESP32, 555, 2N3904).
Three ways to place a part:
- Drag a card onto the canvas and release where you want it.
- Click the card's Place button — the part follows your cursor; click to drop,
Escto cancel. - Double-click the card — the part lands in the middle of the view.
Reference designators (R1, C3, U2, …) are assigned automatically and re-sequenced when you
delete parts. Every part can also carry a free custom label (e.g. PULLUP_SDA) that is shown
next to the designator.
4.2 Selecting, moving, editing
| Action | How |
|---|---|
| Select | Click a part or a wire. Ctrl+A selects everything. |
| Multi-select | Shift-click adds to the selection. |
| Move | Drag. Parts snap to the 20 px grid (toggle snapping in the status bar). |
| Rotate | R or the toolbar button — 90° steps. |
| Copy / paste / duplicate | Ctrl+C, Ctrl+V, Ctrl+D. |
| Delete | Delete / Backspace. |
| Undo / redo | Ctrl+Z / Ctrl+Y. |
| Cancel | Esc clears the selection or cancels placement mode. |
The inspector on the right shows everything about the selection: designator, custom label,
value, rotation, position, the part's parameters (tolerance, power rating, forward voltage, package,
I²C address, …) and the nets its pins are on. Values accept engineering notation: 4.7k, 10M,
100n, 2.2u, 330R, 1Meg. Wires expose their net name and colour.
4.3 Wiring
Wires connect pins. Hover a pin to see its gold terminal, then drag from one pin to another. Notes:
- Wires route orthogonally; drag a waypoint (a corner handle) to reshape a run.
- When two wires cross and connect, a junction dot appears; crossing without a dot means no connection — exactly like paper schematics.
- Net names are automatic (
net_r1_1) but you can rename them in the inspector; a net namedGND(orGROUND,VSS,0V) becomes the circuit ground. - Moving a part drags its wires with it — the pins keep their connections.
4.4 Sheets, examples and modules
The Explorer tab shows your project's sheets, the shipped examples (click one to open it —
the current canvas asks for confirmation first, and your session autosave keeps a copy), and any
.edamod modules you imported. Tools ▸ Insert Hierarchical Sheet… turns a saved sheet into a
reusable block: its sheet ports become the block's pins, so one RC filter sheet can be dropped
three times to build a filter chain.
5. Running the simulation
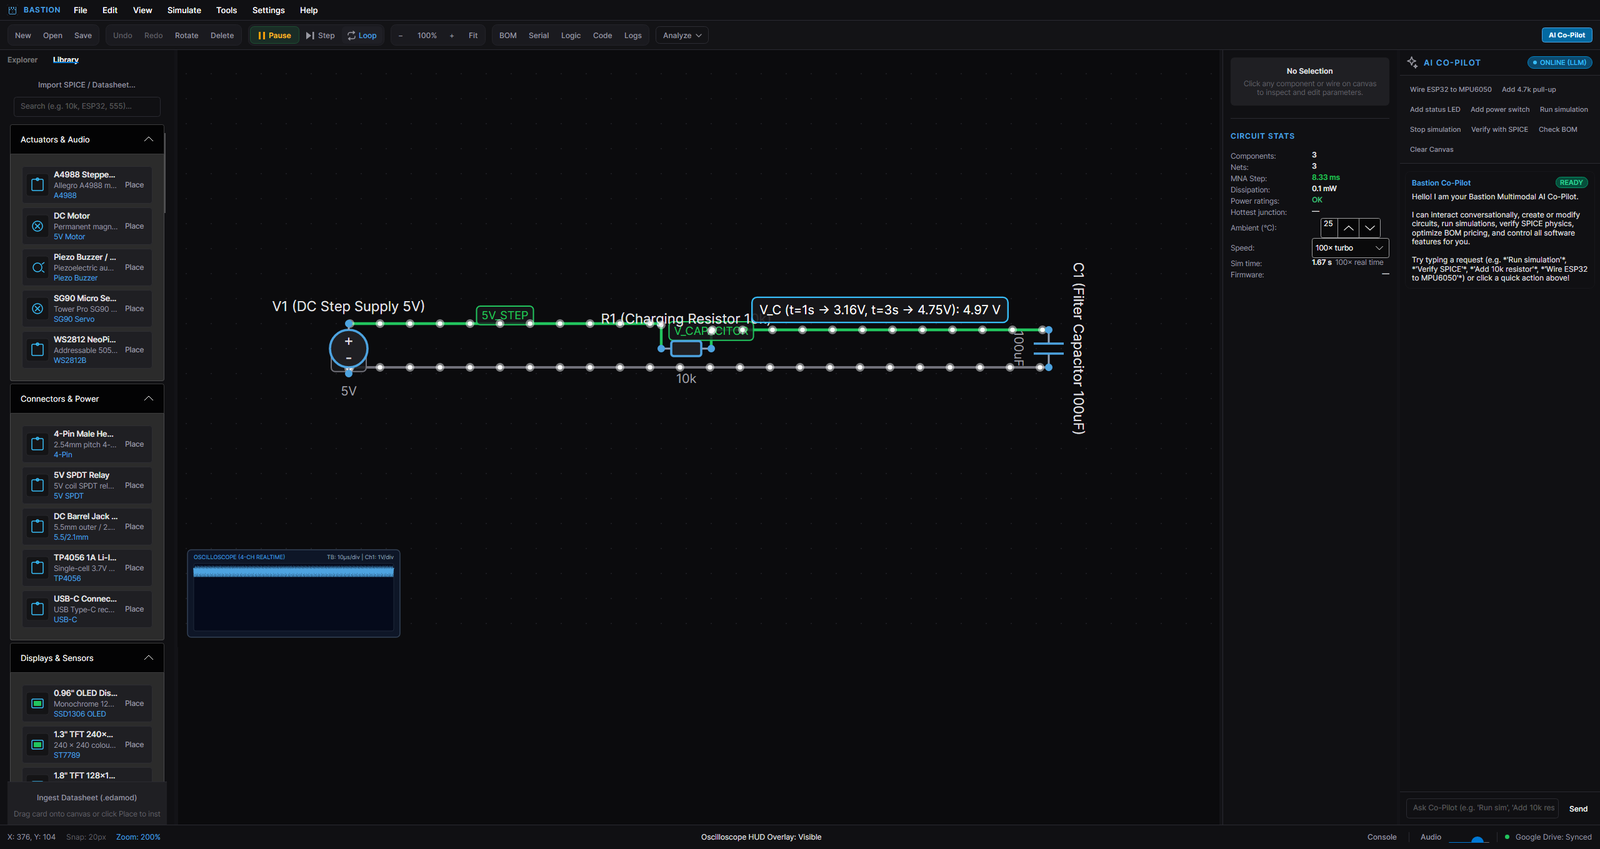
5.1 Controls
| Control | What it does |
|---|---|
Run / Pause (F5) |
Starts or pauses the solver |
Step (F6) |
Advances exactly one 10 µs step while paused |
| Loop | Restarts a finished transient circuit automatically (for scopes and animations) |
| Speed (inspector) | Detail (1/80×), 0.1× slow, 1× real time, 10× fast, 100× turbo |
Circuit stats shows the live state: number of components and nets, the MNA step size, total dissipation, the power-rating verdict, the hottest junction, ambient temperature (editable — try 150 °C and watch the derating), simulation time and achieved speed, and the firmware status of any MCU on the canvas.
5.2 What you are looking at
- Wire colour = voltage. Grey is 0 V, green rises with positive voltage, red for negative.
- Particles = current. Speed and direction follow the solved branch current; a stalled wire has still particles, a short circuit looks like a river.
- Halos = thermal/power state. Amber (caution, >80 % of a rating) and red (overload) rings appear around parts that are being pushed too hard; a toast and a status message explain which. Semiconductor parts also glow amber-to-red as their junction temperature rises toward its limit.
- Probe readouts float next to nets you attach a probe to (click a wire with the probe tool, or right-click ▸ probe).
5.3 Interactive stimulus
While running you can: click switches and buttons, drag potentiometer wipers, drag sensor sliders (IMU tilt, light, temperature), and — for circuits with a microcontroller — type into the Serial Monitor. Everything takes effect on the next solver step.
6. Virtual instruments
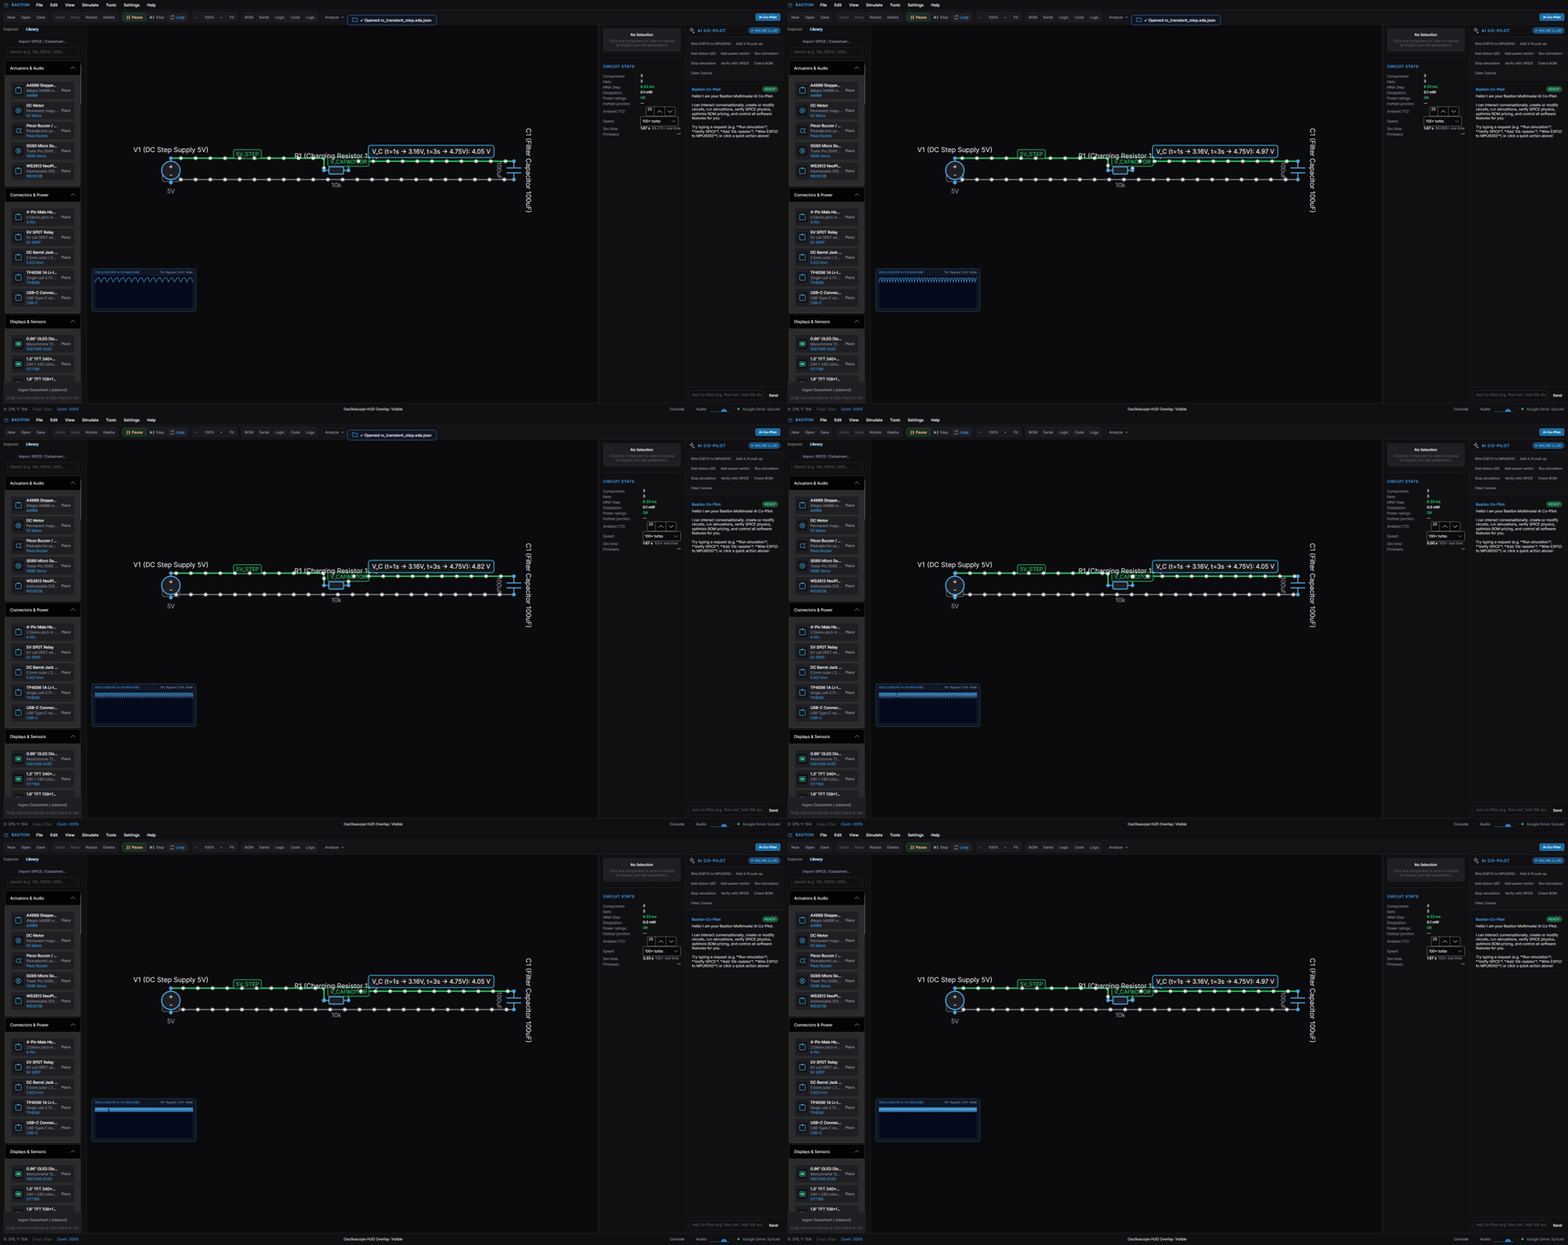
6.1 Oscilloscope
The scope lives in the bottom drawer's overlay (View ▸ Toggle Oscilloscope HUD, Ctrl+Alt+O).
Attach probes by clicking nets with the probe tool; each trace shows voltage over simulated time.
Use the timebase control to zoom the window, and the trigger selector to freeze on a rising or
falling edge — useful for one-shot events like a capacitor charging (see the RC transient example,
where the trace matches the textbook exponential to the pixel).
6.2 Multimeter
The DMM reads the net under the cursor: DC volts, plus current for the selected branch. It is the quickest way to answer "what is this node at?" without opening the scope.
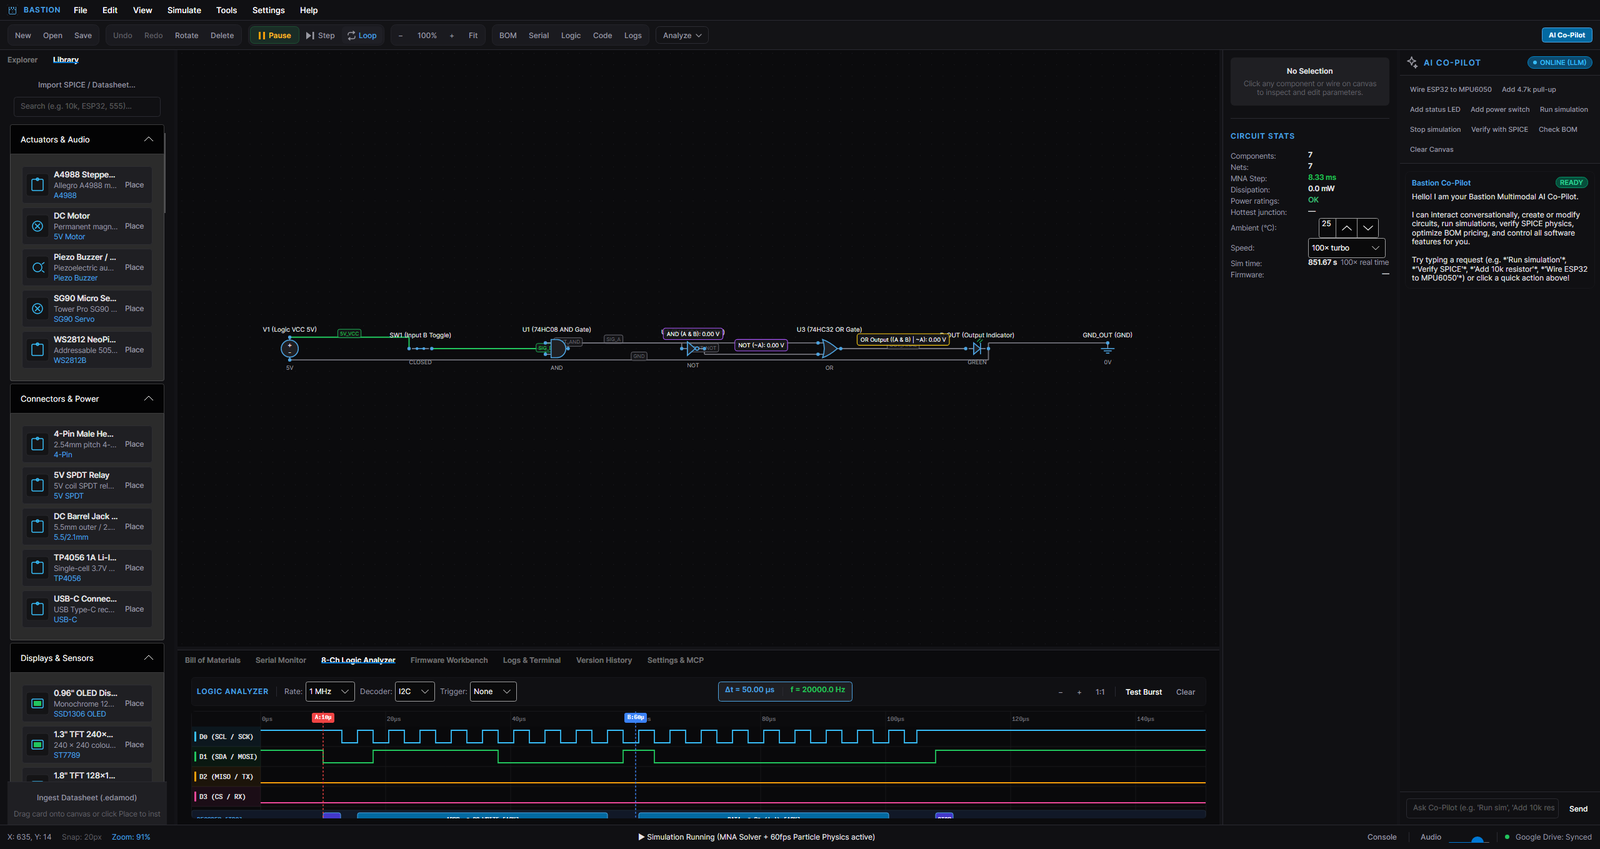
6.3 8-channel logic analyzer
Panels ▸ 8-Ch Logic Analyzer (or the Logic button) shows digital transitions on up to 8 nets — gate outputs, MCU pins, bus lines. It samples the published solution, so it shows exactly what the solver computed, including glitches from propagation delay.
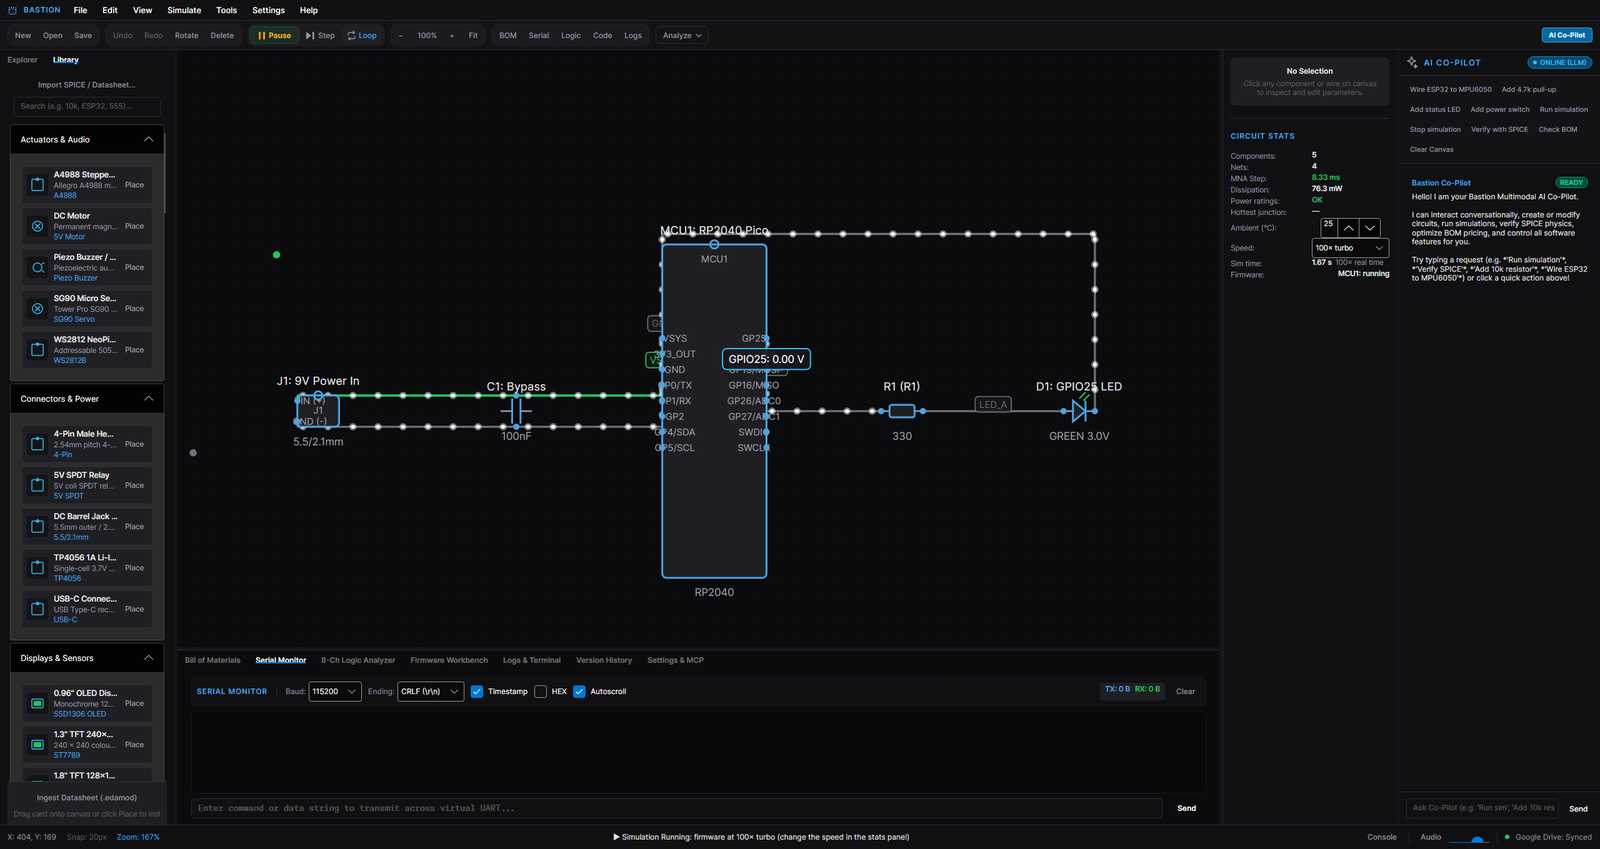
6.4 Serial Monitor
For any circuit with a microcontroller, the Serial tab shows what the firmware prints (and sends what you type). The baud rate is the one the sketch configured; the Linux console of the Milk-V boards appears here too (or in the full terminal window, below).
6.5 Display Monitor
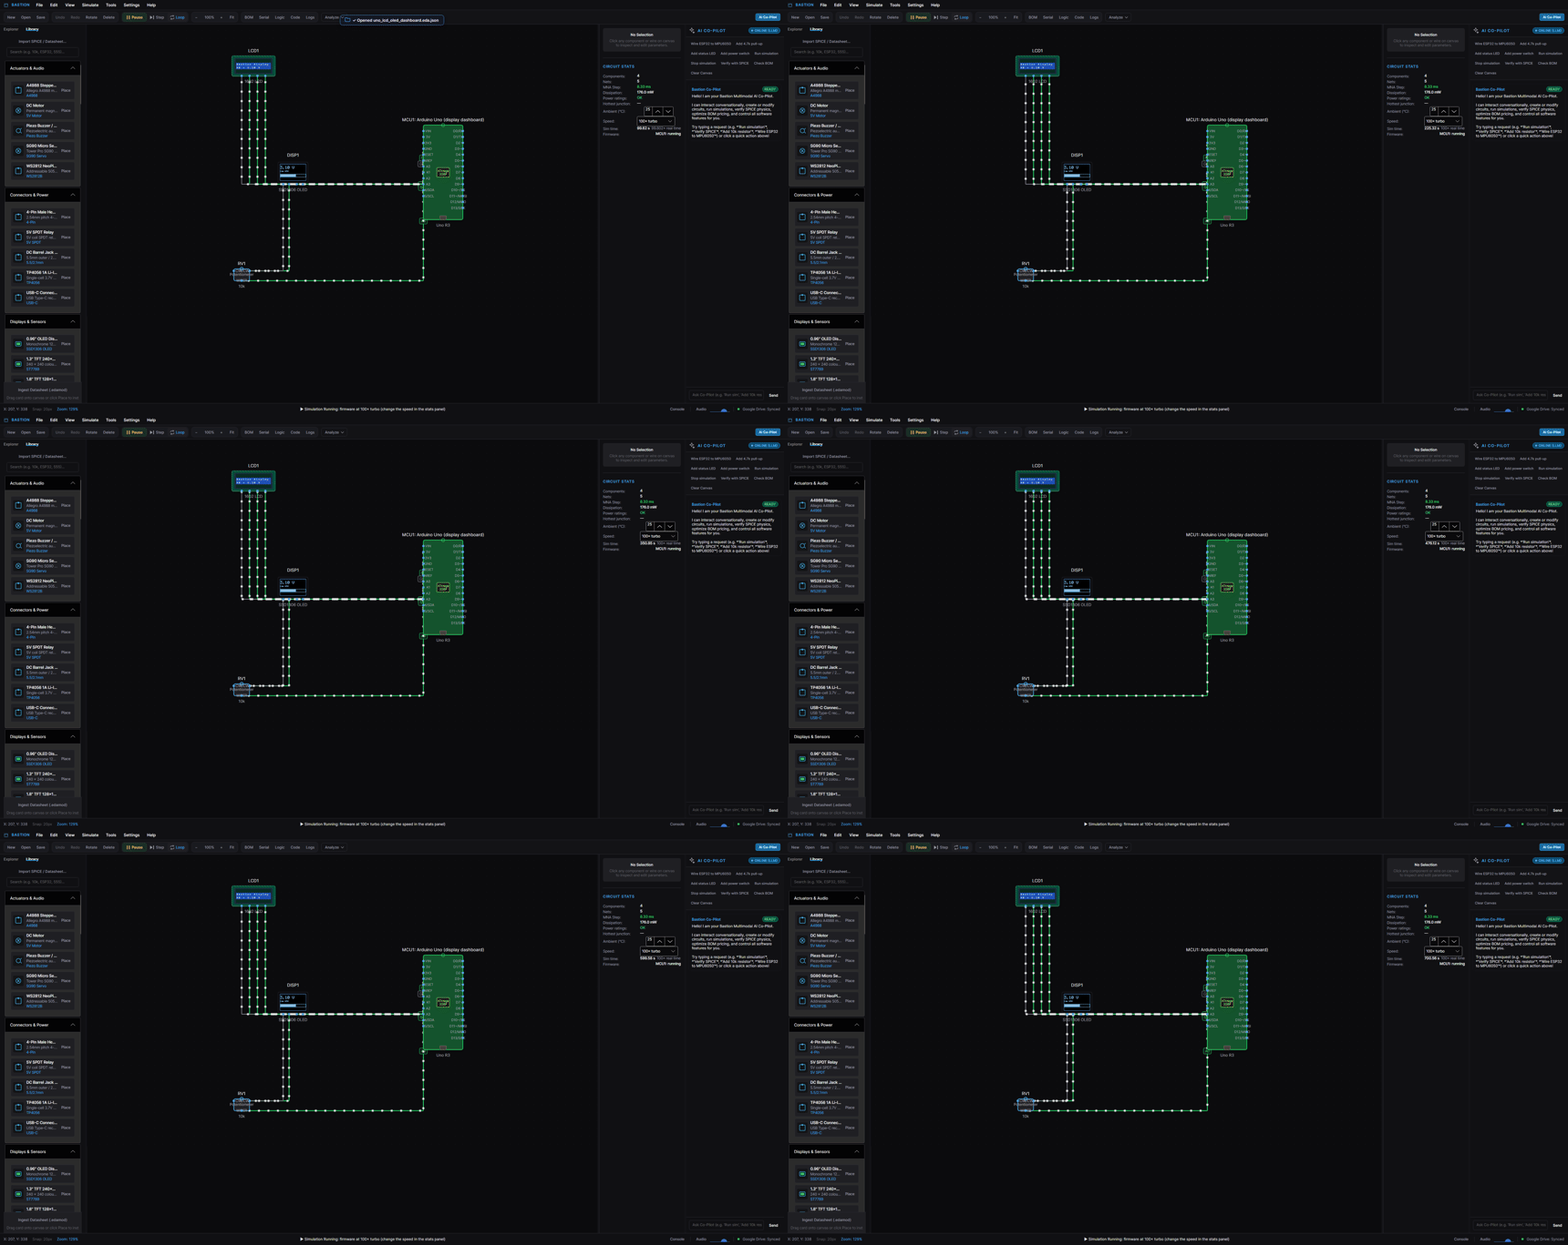
Simulate ▸ Display Monitor… opens a magnified, live view of every simulated display: character LCDs (text), OLEDs and TFTs (pixels), 7-segment digits and LED matrices — each with its power state. This is how you see what your firmware draws without wiring a physical screen.
6.6 Linux terminal
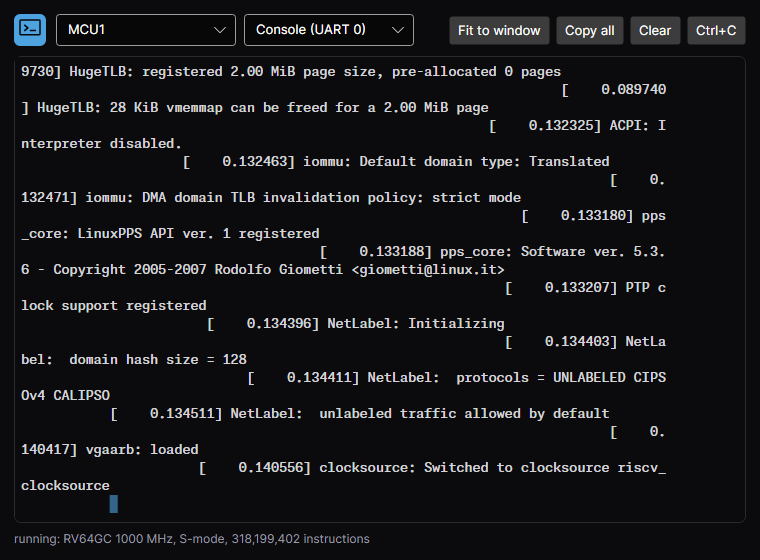
For Milk-V Duo / Duo S circuits running an operating system, Simulate ▸ Linux Terminal… opens a full VT100 terminal to the guest's console: boot log, shell, commands. The toolbar has Copy all, Clear and Ctrl+C; the terminal supports selection, copy/paste and scroll-back.
7. Microcontrollers and firmware
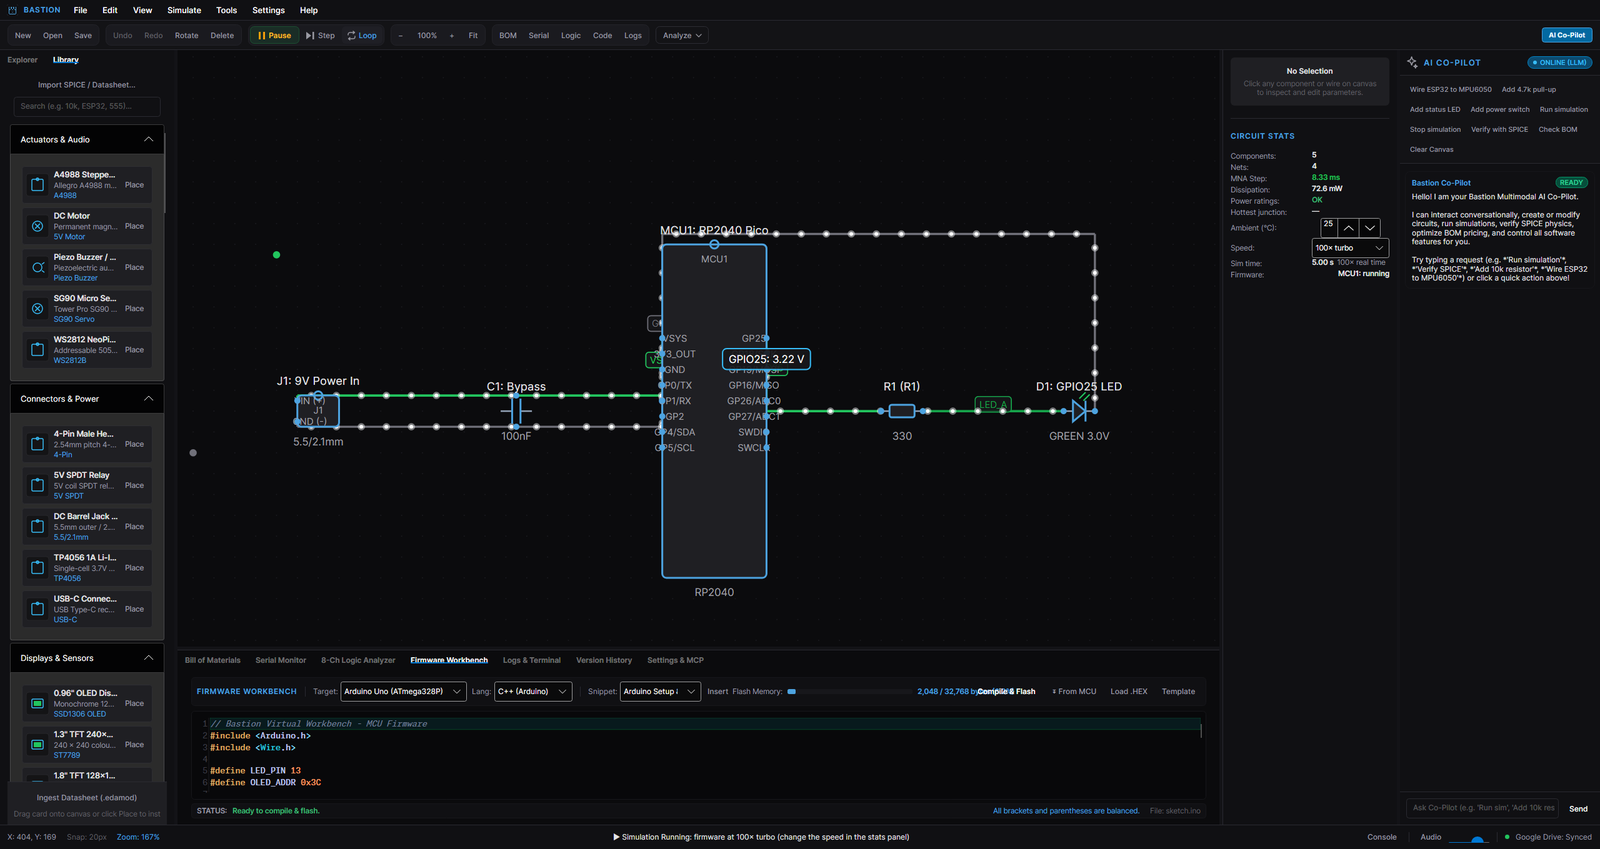
Bastion simulates microcontrollers properly: the chip you place on the canvas runs real firmware, and its pins are real electrical connections. That means your sketch can dim an LED through a resistor, read a real sensor on a real I²C bus, and brown out when the battery sags.
7.1 Choosing a board
The library's Microcontrollers category holds Arduino Uno / Nano / Mega / Leonardo, bare ATmega328P/2560/32U4 chips, RP2040 Pico, RP2350 Pico 2, STM32 "Blue Pill" and F4 boards, ESP32-C3, SiFive HiFive1 (RISC-V), and the Milk-V Duo / Duo S (64-bit RISC-V, with a Linux mode). Each part brings its real pin names, so wiring follows the data sheet.
7.2 The Firmware Workbench
Open it with the Code toolbar button or Tools ▸ Firmware Workbench. You get a code editor with syntax highlighting and line numbers, a language selector, and Compile & Flash.
- Arduino sketch (C/C++) — a large, practical subset of the language plus the Arduino API
(
pinMode,digitalWrite,analogRead,tone,millis,Serial,Wire,SPI,Servo,String) and the common display libraries (LiquidCrystal[_I2C],Adafruit_SSD1306,U8g2,LedControl,Adafruit_ST7735/ILI9341/ST7789). Compile & Flash parses the sketch and starts the simulation; syntax errors are reported with line numbers. - Assembly (RISC-V) — write RV32 assembly; it is assembled in-app.
- Machine code — paste Intel HEX, an ELF (
base64:prefix for binary), or a raw binary for the parts with instruction-set cores (AVR, ARM Cortex-M, RISC-V). The app runs it instruction by instruction. - MicroPython — editor support for MicroPython sources on parts that model it.
The From MCU button loads the firmware currently stored on the selected chip back into the editor.
7.3 A first firmware session
- Open
examples/rp2040_blinky.eda.json(Explorer ▸ Examples). - Press Run — the Pico's LED blinks at 1 Hz, driven by the actual sketch in its firmware slot.
- Open the Firmware Workbench and change the delay to 100 ms; press Compile & Flash — the blink speeds up. The blink is not a canned animation: the core executes the loop and the pin model drives the LED through its resistor, so the LED current and the supply draw change with it.
More examples to try: esp32c3_tilt_monitor (IMU over I²C), stm32_sensor_hub, uno_lcd_oled_dashboard
(LCD + OLED from one sketch), rp2350_fpu_lab (floating-point kernels), milkv_duo_linux_gpio
(a real Linux shell driving pins), drone_altitude_hold (a PID flight controller flying a quadcopter).
7.4 The Linux machine (Milk-V Duo / Duo S)
Those parts have an os parameter. Set it to linux (inspector ▸ Linux board card) and the part
becomes a full 64-bit RISC-V computer: give it a kernel (the app finds firmware/linux/vmlinux
if you have run python firmware/fetch-linux.py), optionally an initrd, a disk image, and a
network segment name. Boot it, open the Linux Terminal, and use the shell — gpio_out 4 1 really
puts 3.3 V on the header pin, and the kernel's own GPIO driver does it.
8. Analysis tools
8.1 SPICE physics linter
Simulate ▸ Verify Circuit Physics (F7) sends the circuit to the SPICE engine (ngspice when
bundled, otherwise the built-in pure-C# engine) and reports convergence plus every rating
violation: wattage above a part's rating, junction temperatures above the package limit, voltage
ratings. This is the "will it release the magic smoke?" check before you order parts.
8.2 Compare solvers (MNA vs ngspice)
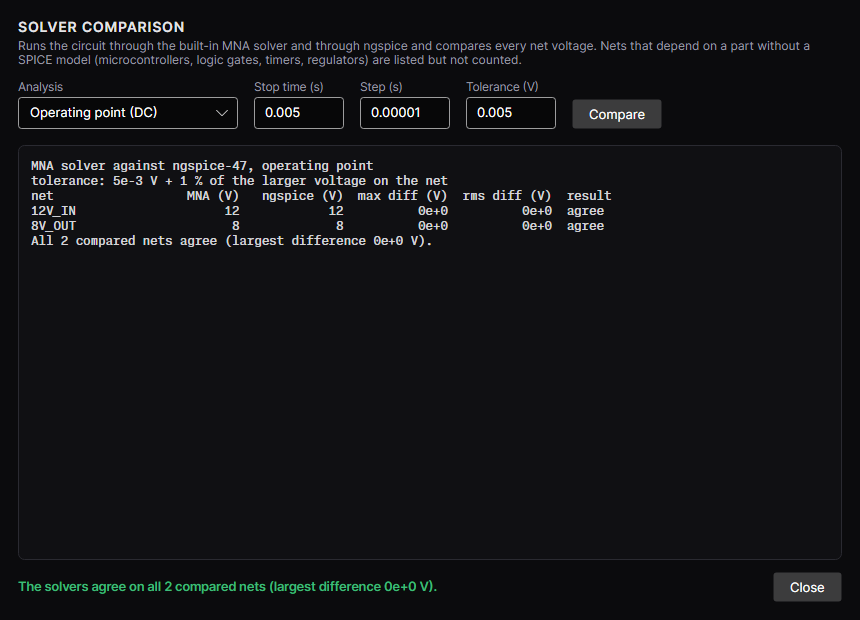
Simulate ▸ Compare Solvers… runs the same circuit through the live MNA solver and through ngspice, and compares every net for the operating point, a transient run, or an AC sweep. Nets that depend on parts without a SPICE model (microcontrollers, radios) are listed as not compared instead of failing. Use this when you want to know how far you can trust a simulation: the closer the numbers, the better both engines are doing.
8.3 AC sweep / Bode plot
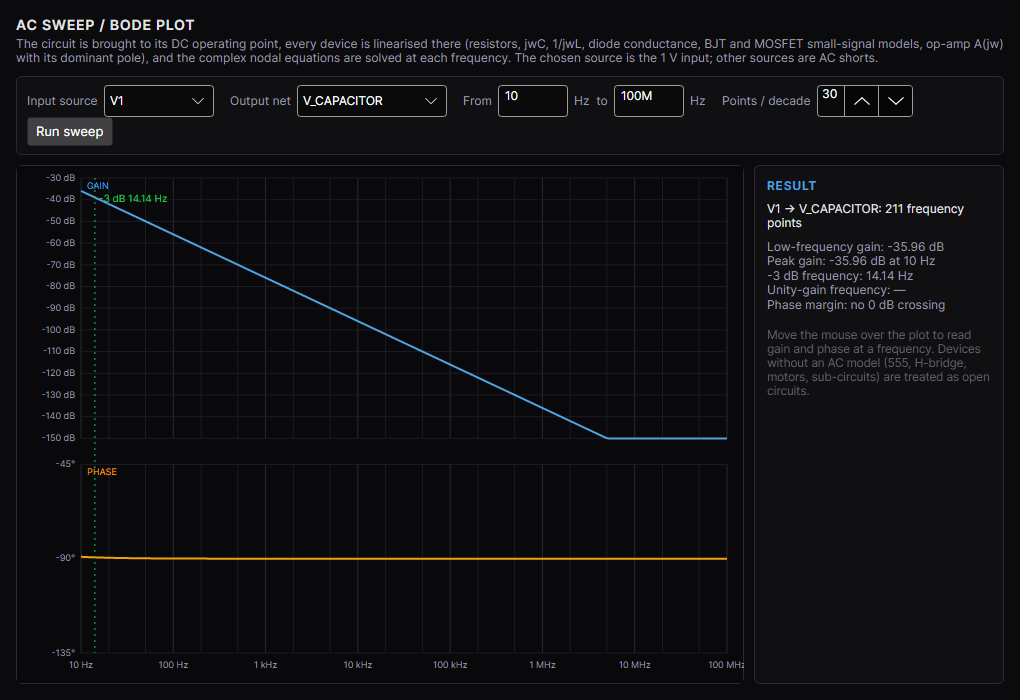
Simulate ▸ AC Sweep / Bode Plot… sweeps the circuit's small-signal response (e.g. 10 Hz – 10 MHz) and draws gain and phase: the −3 dB corner, the unity-gain frequency and the phase margin are marked for you. Works on RC/LC filters, op-amp stages, Sallen-Key topologies — anything with a small-signal model.
8.4 Monte Carlo tolerance analysis
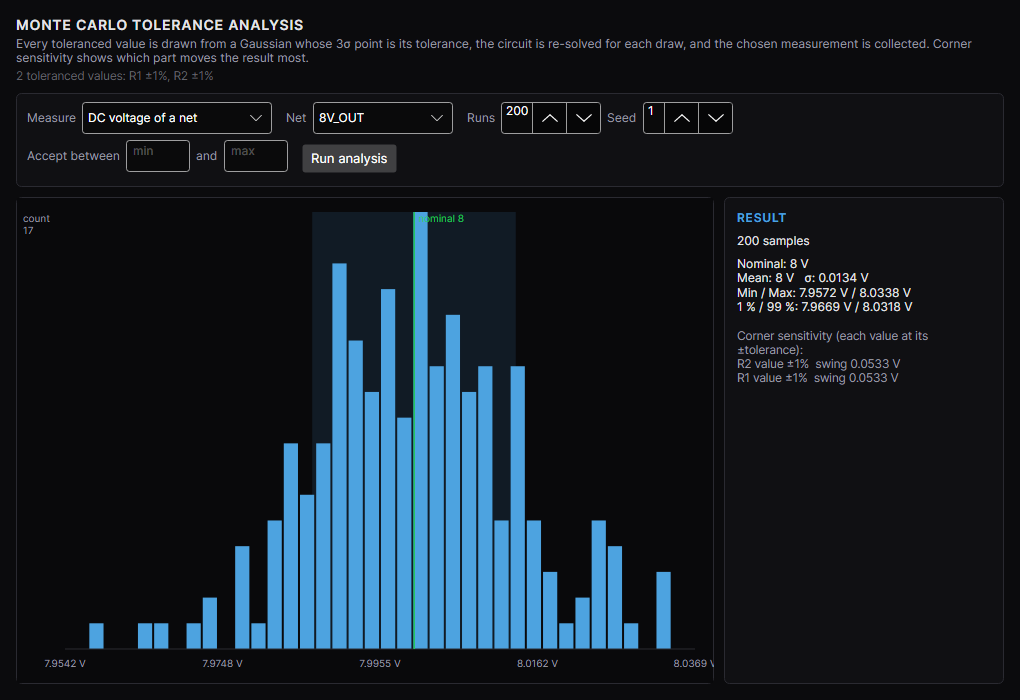
Simulate ▸ Monte Carlo Tolerance Analysis… re-runs the circuit with component values sampled inside their tolerances (R ±5 %, C ±10/20 %, β ±30 %, …) and shows the distribution of the result you care about — a divider voltage, a cutoff frequency, a power figure — with mean, σ, percentiles and a yield estimate against limits. One-at-a-time corner runs show which part dominates the spread.
8.5 Physics self-test
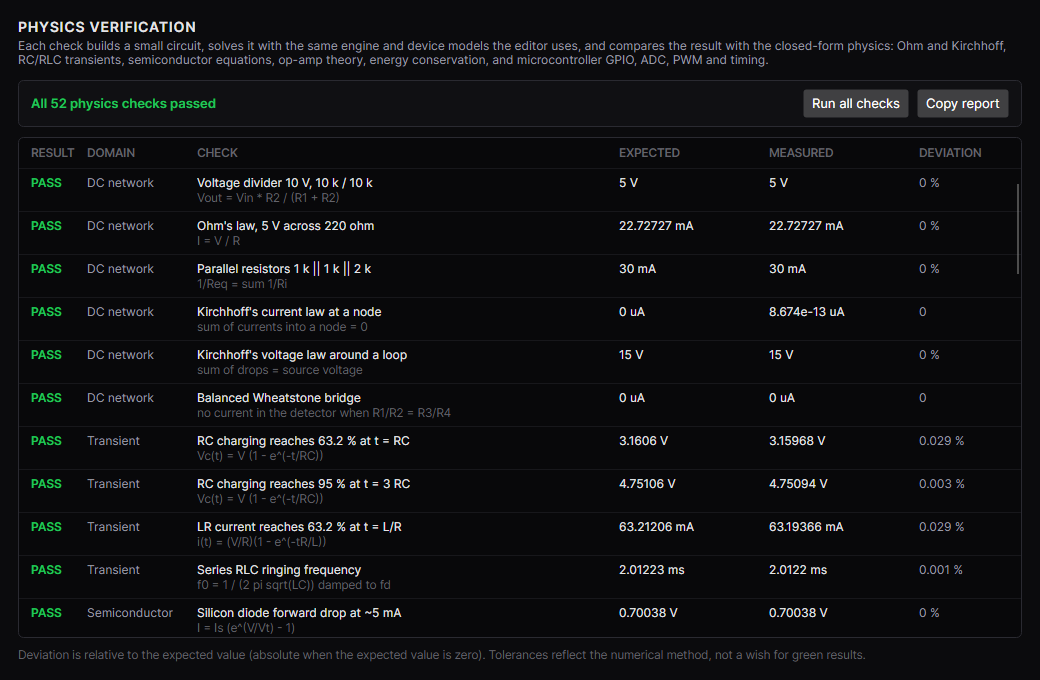
Simulate ▸ Physics Self-Test runs 52 analytic checks (Ohm, KCL/KVL, RC/LR/RLC, diode, BJT, MOSFET, op-amp, 555, regulators, MCUs, radios) and shows expected vs measured vs deviation for each. If you ever doubt the engine, run this first — it is the same suite the automated tests use.
9. Bill of materials and sourcing
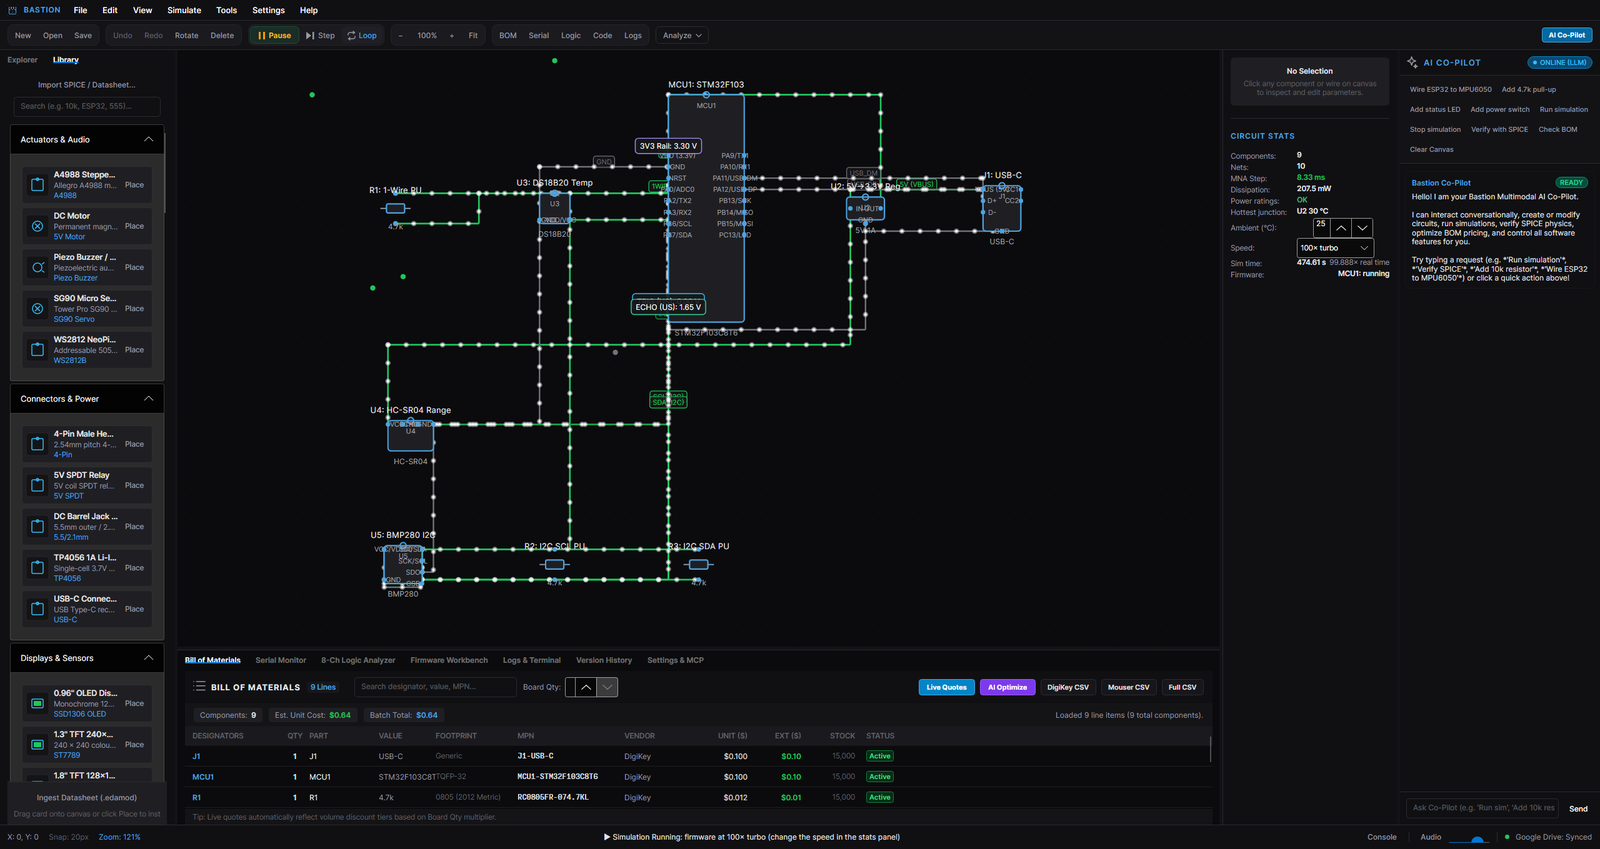
The BOM tab (or Ctrl+Shift+B) lists every part on the schematic: quantity, reference
designators, value, footprint, manufacturer part number, and estimated price. Group by part,
edit MPNs, and export the table as CSV.
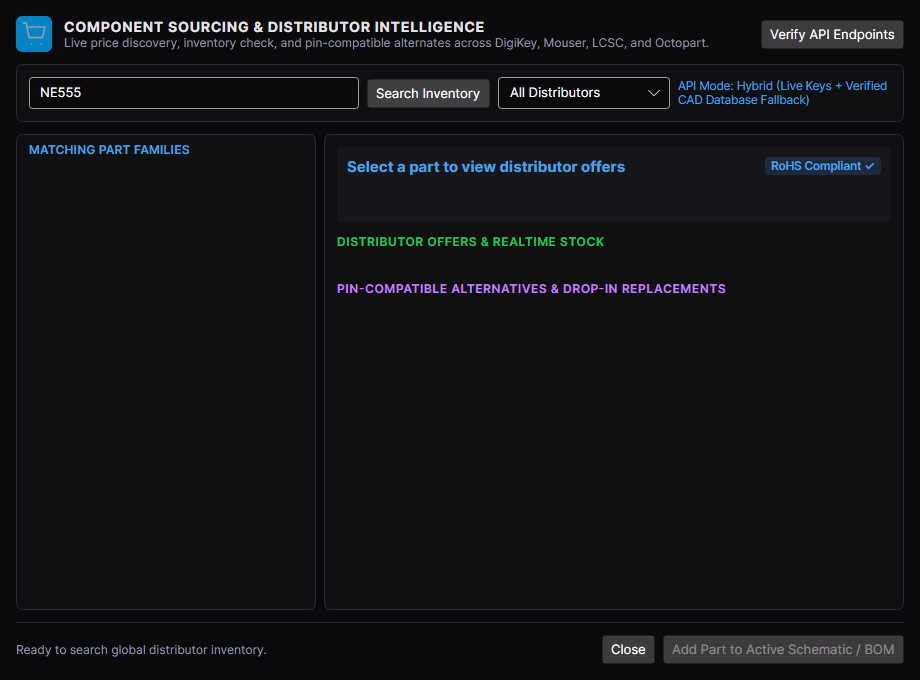
Distributor search (Tools ▸ Component Sourcing & Distributor Search…) queries DigiKey, Mouser, LCSC, Nexar/Octopart and Newark for live stock and pricing. Add your API keys in Settings ▸ Preferences ▸ Distributors; without keys, the search falls back to representative offline data so the workflow still works.
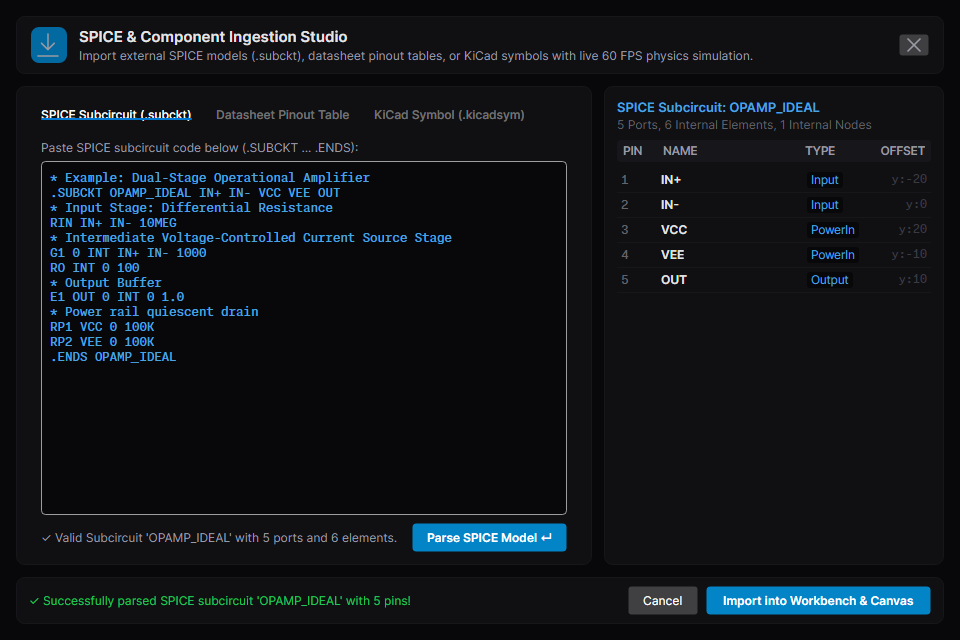
Parts that are not in the library yet come in through the SPICE & Component Ingestion Studio
(Tools ▸ SPICE & Component Ingestion Studio…, also on the Library tab): paste a SPICE
.subckt/.model block, import a KiCad symbol, or type a datasheet pin table, and the part
becomes a first-class library component that the solver understands.
10. Exports and manufacturing
| Export | Where | What you get |
|---|---|---|
| PNG image | File ▸ Export PNG | High-resolution schematic picture |
| SVG vector | File ▸ Export SVG | Scalable drawing for docs and print |
| GIF recording | File ▸ Record Simulation GIF | Animated capture of a running circuit |
| KiCad schematic + netlist | File ▸ Export KiCad | .kicad_sch + .net to continue in KiCad |
| Gerber / drill package | File ▸ Export PCB Gerber… | RS-274X layers + Excellon drill + pick-and-place + SVG preview, as a .zip |
| OpenSCAD enclosure | File ▸ Export OpenSCAD | Parametric .scad 3D-printable case sized to the board |
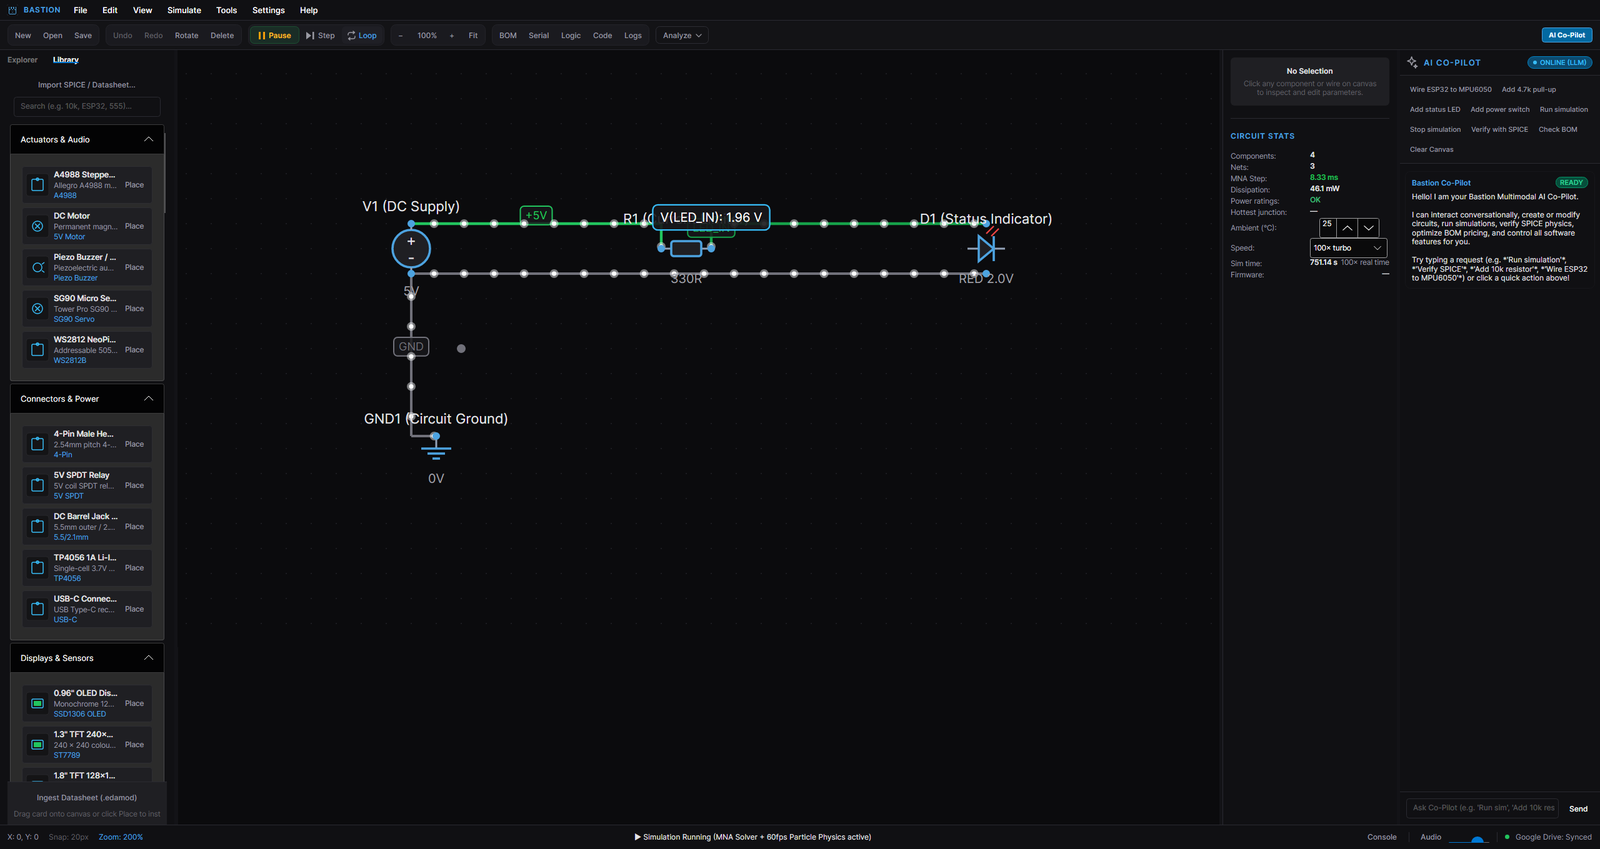
The PCB Layout Editor (Tools ▸ PCB Layout Editor…) shows the auto-generated board: footprints
placed in rows, nets routed on two layers with vias, ground pour with thermal reliefs, silkscreen
designators. Drag parts to move them, R to rotate, L to lock, Auto-place to re-pack, and
Reroute to re-run the maze router; design-rule violations (clearance, board edge, unconnected
nets) are listed and highlighted. Every shipped example produces a board with zero DRC violations.
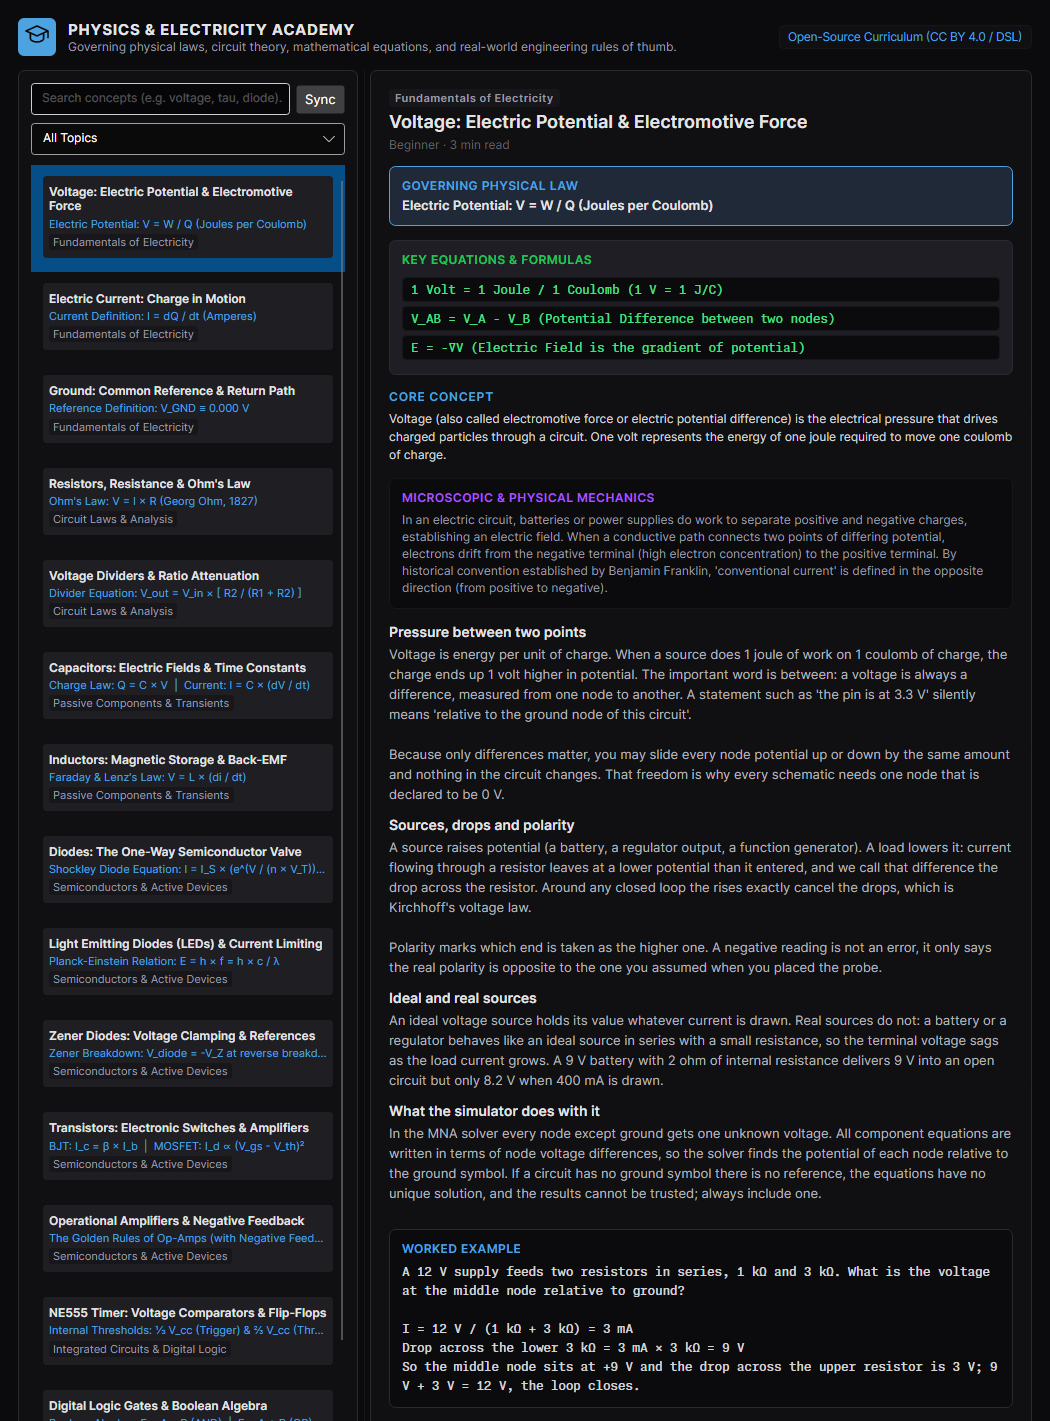
11. The Academy and the glossary
Help ▸ Physics & Electricity Lessons (or Ctrl+Shift+L) opens the Academy: 58 lessons from
"what is voltage" to RTOS scheduling and PCB design, each with sections, a worked example, common
mistakes, things to try, self-check questions and links to related lessons. Lessons that have an
example circuit list it — click to open it on the canvas (with a confirmation, because it replaces
what you have open).
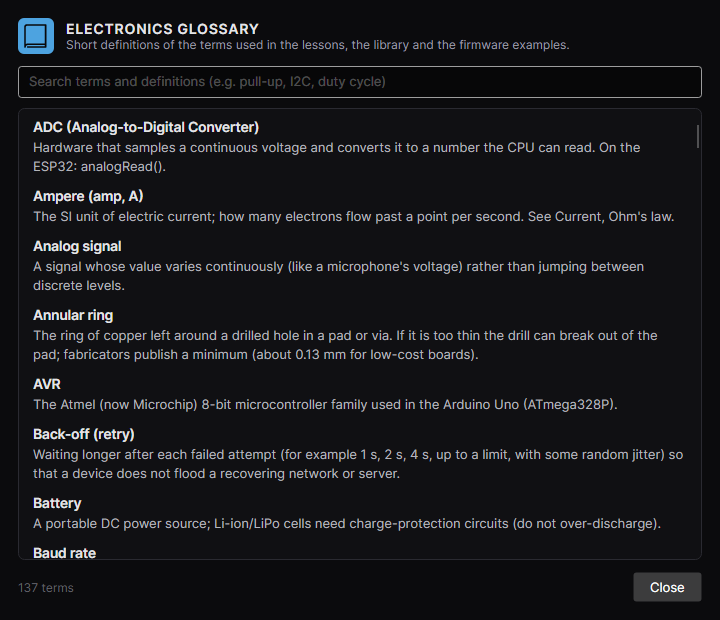
 Help ▸ Electronics Glossary… searches 137 terms with short definitions.
12. The AI co-pilot
The chat panel on the right (toggle with Ctrl+I) is a working assistant, not a chatbot bolted on:
it can see your schematic and change it.
- Ask questions: "What pull-up do I need for 400 kHz I²C?" — answered with the current circuit as context.
- Ask for changes: "Wire an ESP32 to an MPU-6050 with 4.7k pull-ups", "Add a green status LED with a 330 Ω resistor", "Create a 555 astable at 1 kHz". The co-pilot answers with an atomic patch; you see exactly what will be added or changed before anything is applied, and existing parts keep their positions (the zero-scramble guarantee).
- Run things: "Run the simulation", "Verify with SPICE", "Check the BOM".
Providers: Google Gemini, Anthropic Claude, OpenAI-compatible endpoints (including local Ollama) —
configure in Settings ▸ Preferences. Without a key, the co-pilot still handles common build
requests with its built-in deterministic synthesizer (status line: ONLINE (CAD)).
13. The MCP server: driving Bastion from outside
Bastion runs a Model Context Protocol server (JSON-RPC 2.0) so other programs — Claude Desktop,
IDE agents, your own scripts — can read and drive the workbench. It starts automatically on
http://localhost:8765/mcp/ (change the port in Settings ▸ Preferences ▸ MCP Server; a
stdio transport is also selectable, and the Copy MCP Client Config button produces a ready
config block).
What an external tool can do (37 tools): read the canvas, the netlist, the BOM, telemetry, logs and the Academy; place and modify components; route nets; run, pause and step the simulation; run the SPICE verification and the ngspice cross-check; read instruments and displays; write and flash firmware; import SPICE subcircuits, KiCad symbols and datasheet pinouts; export artifacts; query distributors; switch themes; and ask the co-pilot. 8 resources expose the same state for clients that prefer subscriptions.
Every call is audited (purple [AUDIT] entries in the console) and snapshotted, so anything an
external agent does can be reviewed and rolled back in File ▸ Version History.
Example — read the live telemetry of a running circuit with curl:
curl -s -X POST http://localhost:8765/mcp/ -H "Content-Type: application/json" \
  -d '{"jsonrpc":"2.0","id":1,"method":"tools/call","params":{"name":"get_simulation_telemetry","arguments":{}}}'
14. Files, sessions, history and settings
- Save / Open:
Ctrl+Ssaves (a named file saves instantly with a toast; an unnamed draft opens the in-app save dialog).Ctrl+Shift+Sis Save As,Ctrl+Oopens. Recent files appear in the Explorer and are restored at launch together with the canvas position and zoom. - Autosave: your session is written continuously; a crash or a forced close loses at most the last moments. The autosave can be restored from the Explorer.
- Version history (File ▸ Version History & Snapshots…): every save, snapshot and MCP-driven change creates a snapshot with a structural summary; diff and restore any of them.
- Settings (Settings ▸ Preferences & Options…): AI provider and keys, distributor keys and currency, the Google Drive folder mirror (a local copy - no cloud login), curriculum repository, MCP server (transport, port, autostart), theme. Themes: Dark (Default), High Contrast Dark, Clean Light.
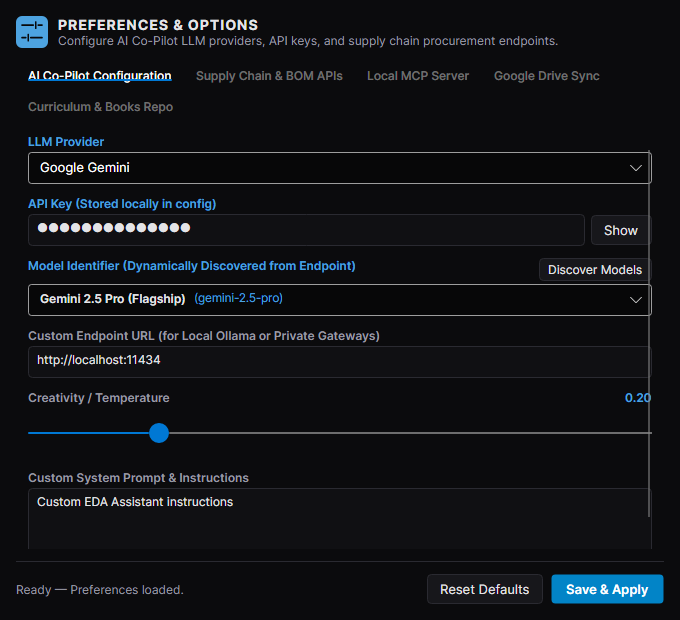
- Drive folder mirror (File ▸ Mirror Workspace to Drive Folder): copies every sheet into a mirror folder on this PC - Bastion makes no Google API call and no OAuth login. Point the target folder (Settings ▸ Google Drive Sync) at a folder your Google Drive / OneDrive / Dropbox desktop client already syncs, and that client uploads the mirror.
- Where things live: settings, session and autosave in
%APPDATA%\Bastion; your circuits wherever you save them (plain.eda.jsontext files — readable, diffable, git-friendly).
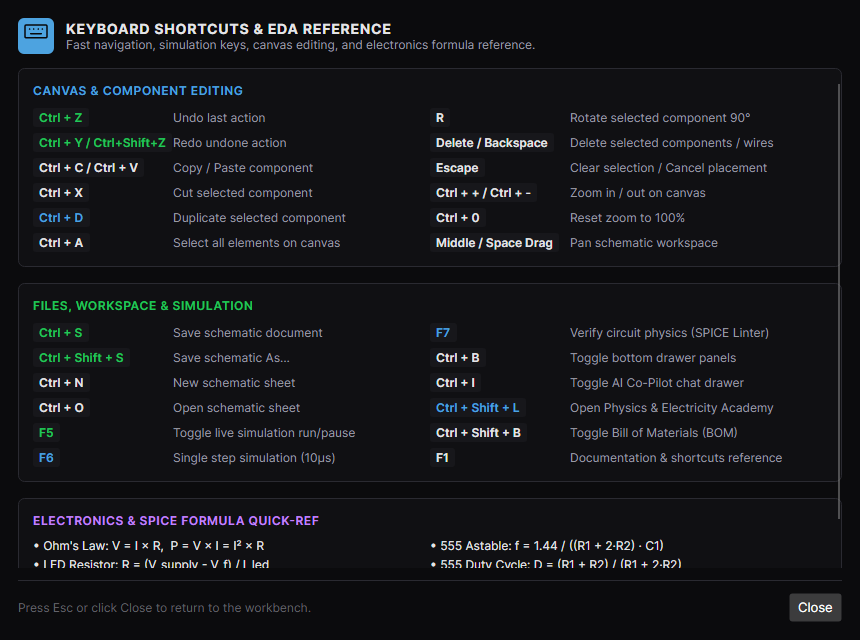
15. Keyboard shortcuts
| Shortcut | Action | Shortcut | Action | |
|---|---|---|---|---|
Ctrl+N |
New sheet | F5 |
Run / pause simulation | |
Ctrl+O |
Open sheet | F6 |
Single step (10 µs) | |
Ctrl+S |
Save | F7 |
Verify physics (SPICE linter) | |
Ctrl+Shift+S |
Save As | Ctrl+Alt+O |
Toggle oscilloscope | |
Ctrl+Z / Ctrl+Y |
Undo / redo | Ctrl+Alt+T |
Toggle physics tooltips | |
Ctrl+C/V/X/D |
Copy / paste / cut / duplicate | Ctrl+B |
Toggle bottom drawer | |
Ctrl+A |
Select all | Ctrl+I / Ctrl+J |
Toggle AI co-pilot | |
R |
Rotate 90° | Ctrl+Shift+B |
Toggle BOM | |
Delete / Backspace |
Delete selection | Ctrl+Shift+L |
Physics & Electricity Academy | |
Esc |
Cancel / deselect | Ctrl+Shift+P |
Developer console & logs | |
Ctrl + + / Ctrl + - |
Zoom in / out | F12 |
Developer console & logs | |
Ctrl+0 |
Zoom 100% | F1 |
Documentation & shortcuts |
(The full reference, with the electronics formula card, is in Help ▸ Documentation & Shortcuts.)
16. Troubleshooting
| Symptom | What to check |
|---|---|
| Simulation does not start | Is there a ground? A circuit with no GND net has no reference. The status bar says why if not. |
| A wire stays grey and nothing flows | That net is at 0 V — check for a missing connection (junction dots), an open switch, or a pin you think is wired but is not (hover it). |
| "Failed to converge" | A pathological circuit (ideal voltage sources fighting, a floating node). Add a real resistance/ground, or slow the step. The message names the node. |
| Something is red-haloed | Overload: the toast names the part and the rating. Reduce current, uprate the part, or lower ambient temperature. |
| Sketch errors on flash | The status shows the line and message; unknown pins are reported by name. |
| No displays in the Display Monitor | The firmware must initialise them (charge pump, backlight, function set) — a panel that is never initialised stays dark, exactly like the real part. |
| ngspice features missing | The bundled library did not load (rare); the app falls back to the built-in SPICE engine and says so. |
| Linux board will not boot | Run python firmware/fetch-linux.py once to download the kernel (it is GPL software and not shipped with the app); the Linux board card shows the expected path. |
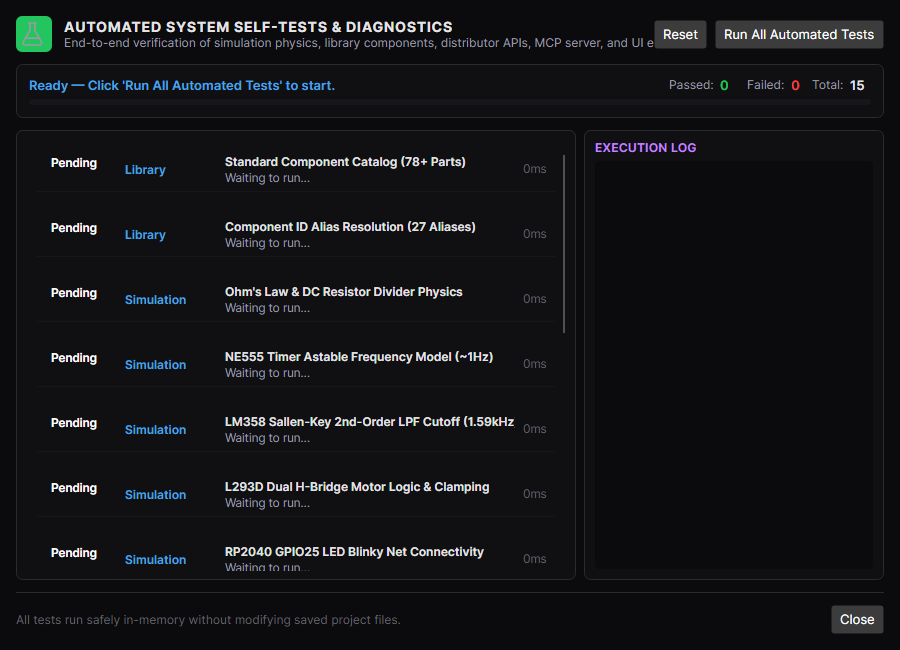
If something looks broken, run Tools ▸ Run Automated Self-Tests & Diagnostics…: the app re-checks its own subsystems (solvers, devices, MCP server, exports) and reports each check with its detail line, so you can tell a real fault from a misunderstanding before filing anything.
17. Accuracy and limits — what you can trust
Bastion's simulation is validated continuously: the automated suite (1800+ tests) asserts the physics laws analytically, the emulator cores are replayed against QEMU and LLVM oracles, every shipped example is solved in both engines, and the MNA solver is compared net-by-net with ngspice. The physics self-test shows you the same checks in-app.
You should still know where the edges are:
- The live solver is a 10 µs-step trapezoidal MNA engine: excellent for circuits up to the audio/switch-mode range; very fast edges and RF are out of scope.
- Semiconductor models are compact (Shockley diode, Gummel-Poon-flavoured BJT, level-1 MOSFET, single-pole op-amp). They are honest about the effects they model and silent about the ones they do not.
- Microcontroller cores are validated instruction by instruction, but peripherals are modelled at the level documented per part — check the developer guide's limitations section before relying on an exotic register.
- The AI co-pilot is a helpful colleague, not an authority: its patches are previewed and undoable, and you should verify anything safety-critical with the SPICE gate and your own judgement.
Bastion Circuit Designer 0.9.1-alpha — user manual. Screenshots and animations in this manual are
captures of the real application. For deeper material see the Architecture & Developer Guide and
the Electricity & Physics handbook in docs/.
Updated 2026-11-03